Knowledge fuels change - Support energypedia!
For over 10 years, energypedia has been connecting energy experts around the world — helping them share knowledge, learn from each other, and accelerate the global energy transition.
Today, we ask for your support to keep this platform free and accessible to all.
Even a small contribution makes a big difference! If just 10–20% of our 60,000+ monthly visitors donated the equivalent of a cup of coffee — €5 — Energypedia would be fully funded for a whole year.
Is the knowledge you’ve gained through Energypedia this year worth €5 or more?
Your donation keeps the platform running, helps us create new knowledge products, and contributes directly to achieving SDG 7.
Thank you for your support, your donation, big or small, truly matters!
Country Project Nigeria
This article is written by Charlotte Remteng, Muhammad Bello Suleiman, Chiamaka Maureen Asoegwu and Chysom Nnaemeka Emenyonu as part of the requirements for the Open Africa Power Fellowship Programme 2021. Click here to download the pdf version of this article.
Introduction/overview of the country
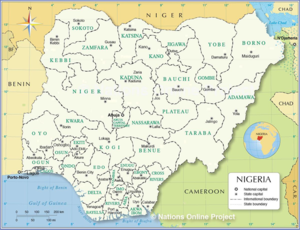
The Federal Republic of Nigeria, a country in the southeast of West Africa, with coast at the Bight of Benin and the Gulf of Guinea. Nigeria is bordered by Benin, Cameroon, Chad, and Niger, it shares maritime borders with Equatorial Guinea, Ghana, and São Tomé and Príncipe, with an area of 923,768 km². Nigeria's main rivers are the Niger, where it got its name from, and the Benue, the main tributary of the Niger. The country's highest point is Chappal Waddi (or Gangirwal) with 2,419 m (7,936 ft.), located in the Adamawa mountains in the Gashaka-Gumti National Park, Taraba State, on the border with Cameroon. Nigeria's latitude and longitude is 10° 00' N and 8° 00' E.
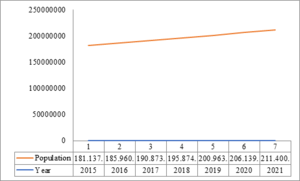
A key regional player in West Africa, Nigeria accounts for about half of West Africa's population with approximately 202 million people and one of the largest populations of youth in the world. With an abundance of natural resources, it is Africa's biggest oil exporter and has the largest natural gas reserves on the continent (World Bank, 2020). Figure 2 below is Nigeria's population trend from 2015-2021. Nigeria is a multi-ethnic and culturally diverse federation that consists of 36 autonomous states and the Federal Capital Territory (J.E Opute, 2020). The political landscape is partly dominated by the ruling All Progressives Congress party (APC. Since 2011, the Nigerian security landscape has been consistently shaped by the war against Boko Haram terrorist groups in the northern states (UNDP, 2021). This adds to a lasting crisis in the oil-rich Niger Delta, where several non-state armed groups attack oil companies and state-owned pipelines.
According to the World Bank country brief on Nigeria, it is the second-largest economy in sub-Saharan Africa and accounts for 41 percent of the region's GDP. GDP growth: 2.3 percent (2019), GDP per capita: US$6,054 and Key goods and services traded; Wheat, crude oil (Nigeria Market Insights 2021). However, according to the National Bureau of Statistics, Nigeria’s economy contracted 1.5 percent in 2016 due to lower oil revenues and a shortage of hard currency. Nigeria has also been highly vulnerable to the global economic disruption caused by COVID-19, particularly due to the pronounced decline in oil prices and spikes in risk aversion in global capital markets (World Bank, 2020). Furthermore, The National Bureau of Statistics (NBS) recently released the “2019 Poverty and Inequality in Nigeria” report, which highlights that 40 percent of the total population, or almost 83 million people, live below the country’s poverty line of 137,430 naira ($381.75) per year. COVID-19 is deepening poverty and inequality that already exists in the country with 53 million people vulnerable to fall into poverty (World Bank 2020), thus, alleviating the impacts of the COVID-19 crisis is vital for preventing poverty from deepening and increasing in Nigeria. The unemployment rate in Nigeria increased to 33.30 percent in the fourth quarter of 2020 from 27.10 percent in the second quarter of 2020 (National Bureau of Statistics, Nigeria). According to the UNDP gender equality assessment, although there are more women than ever in the labor market, there are still large inequalities in some regions, with women systematically denied the same work rights as men. Sexual violence and exploitation, the unequal division of unpaid care and domestic work, and discrimination in public office all remain huge barriers. Climate change and disasters continue to have a disproportionate effect on women and children, as do conflict and migration.
Critical environmental problems in Nigeria include; Sheet erosion, gully erosion, coastal and Marine erosion, and land subsidence occur particularly in coastal areas, flooding occurs throughout Nigeria in three main forms; coastal flooding, river flooding, and urban flooding, drought and Desertification, oil Pollution from spills, climate change, loss of biodiversity, urban Decay and Squatter Settlements Industrial Pollution and Waste, etc.
Table 1 below shows some key socio-economic indicators.
Evolution and present situation of power system
Energy Supply
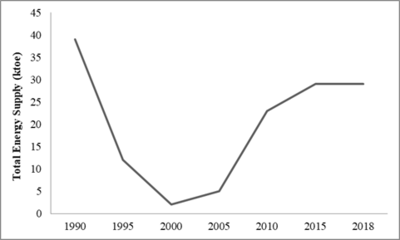
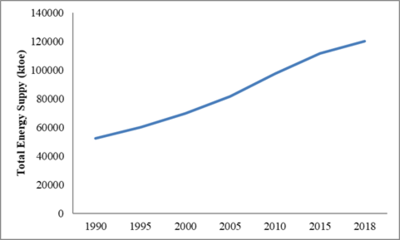
Fossil fuels: coal, oil, and natural gas have been the principal sources of energy in Nigeria.The trends in the total energy supply for coal from 1990 to 2018 are shown. By 1990, there was a steep decline until 2000. An increase in the use of coal is seen from 2000 till 2015 till about 2018 when it fell slightly (Figure 3). Coal was discovered in Nigeria in 1909 in Enugu, eastern Nigeria, with early production dating back to 1916. About 24,500 tonnes of coal was produced and used for mass (railway) transportation, which increased electricity generation, and industrial activities.
Today, 80% of power generation comes from gas; most of the remainder comes from oil, with Nigeria being the largest user of oil-fired backup generators on the continent. Natural gas remains the main source of power in the AC, although there is a shift towards solar PV as the country starts to exploit its large solar potential (IEA, 2019).
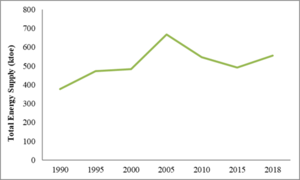
Figure 4 below shows the increase in the Total Energy Supply (TES) for Natural gas, where there is a gradual increase up until 2005 where there was a slight fall with a spiky increase from 2010 till 2018.
Oil production spikes from 1990 to 1994, and from 1995, there was a drastic drops with slight increases over the years as shown in figure 5 below.
Total energy supply from Hydro on the other hand increased for over a decade (1990-2000), with sharp increase between 2000 and 2005, followed by falls till 2015 when TES from hydro increase from about 450 to 550 ktoe (Figure 6).
The total supply from Biofuel and Wastes increased almost steadily from 1990-2018 as shown on Figure 7.
Generation, Transmission, and Distribution
Generation
According to the Nigerian Electricity Regulation Commission (NERC), electricity generation started in Nigeria in 1896 but the first electric utility company, known as the Nigerian Electricity Supply Company, was established in 1929.
The first Nigerian electrical power plant was built in 1896 comprising of a 30kw, 1000v, 80cycle, single-phase supply, with an additional unit installed in 1902, and by 1909, installed capacity had reached 120KW with a registered energy demand of 65KW (Edomah et al., 2016). In 1920, the installed capacity for the Lagos Marina power station was 420 kW. The first coal-fired power plant was built and commissioned on 1 June 1923 with a total installed capacity of 3.6 MW and a 3-phase, 4-wire, 50-cycle system adopted in 1924 (Edomah et al., 2016) with a shutdown of the Marina site on 28 November 1923. The new power station further grew in installed capacity to 13.75 MW. Despite this growth, between 1944 and 1948, Nigeria started experiencing a decline in the use of coal for electricity generation as a result of reduced mining activities, as well as the small discoveries of crude oil to the large scale discovery of oil in Nigeria in 1956. Due to frequent outrages, the Niger Dams Authority (NDA) under whose scheme three hydro and three thermal generating plants were constructed (Davidson et al., 2001). An increase in Nigeria's total population was not marked by a consequent increase in available power. Subsequently, in 1988, available power was increased to 1273 MW. By 1992 population had increased to about 80 million however, the total available power was 3,000 MW (Sule, 2010).
In the 1990s the Nigerian electricity system was failing to meet Nigeria's power needs, leading to the National Electric Power Policy of 2001, and several other reforms (KPMG, 2016). By the year 2000, a state-owned monopoly, the National Electric Power Authority (NEPA), was in charge of the generation, transmission, and distribution of electric power in Nigeria. It operated as a vertically integrated utility company and had a total generation capacity of about 6, 200 MW from 2 hydro and 4 thermal power plants. This resulted in an unstable and unreliable electric power supply situation in the country with customers exposed to frequent power cuts and a long period of power outages and an industry characterized by lack of maintenance of power infrastructure, outdated power plants, low revenues, high losses, power theft, and non-cost reflective tariffs.
By 2001, the Independent Power Producers (IPPs) and National Integrated Power Projects (NIPP) were established to remedy the power shortage situation. In 2005, Nigeria had an estimated 6,861 MW of installed electricity generating capacity (Babatunde and Shauibu, 2011).
Nigeria’s energy transformation was marked by vertical unbundling of Nigeria’s power sector resulted in 6 generating companies and IPPs which are jointly referred to as Gencos. The transformation started with the establishment of the Electricity Cooperation of Nigeria (ECN) in 1951 and the Niger Dam Authority (NDA) in 1962. The ECN and NDA were merged through Degree 24 of 1972 to form the Nigerian Electric Power Authority (NEPA), later called Power Holding Company of Nigeria (PHCN). In the year 2001, the reform of the electricity sector began with the promulgation of the National Electric Power Policy which had as its goal the establishment of an efficient electricity market in Nigeria. It had the overall objective of transferring the ownership and management of the infrastructure and assets of the electricity industry to the private sector with the consequent creation of all the necessary structures required to forming and sustain an electricity market in Nigeria.
In 2005 the Electric Power Sector Reform (EPSR) Act was enacted and the Nigerian Electricity Regulatory Commission (NERC) was established as an independent regulatory body for the electricity industry in Nigeria. In addition, the Power Holding Company of Nigeria (PHCN) was formed as a transitional corporation that comprises of the 18 successor companies (6 generation companies, 11 distribution companies, and 1 transmission company) created from NEPA (See Table 2 below). In 2005, the total site rating of installed capacities at all Power Holding Company of Nigeria (PHCN) power stations was 6656.40MW but with an average available capacity of 3736.55MW, hence having a percentage availability of 56.13%. In July 2009 the total installed generation capacity of the PHCN plant was 9,914.4MW while 1,115.MW was from IPPs (Onuoha. K, 2010; Buraimoh. E et al. 2017).
Table 2: Generation Companies Created following the unbundling of PHCN

