Knowledge fuels change - Support energypedia!
For over 10 years, energypedia has been connecting energy experts around the world — helping them share knowledge, learn from each other, and accelerate the global energy transition.
Today, we ask for your support to keep this platform free and accessible to all.
Even a small contribution makes a big difference! If just 10–20% of our 60,000+ monthly visitors donated the equivalent of a cup of coffee — €5 — Energypedia would be fully funded for a whole year.
Is the knowledge you’ve gained through Energypedia this year worth €5 or more?
Your donation keeps the platform running, helps us create new knowledge products, and contributes directly to achieving SDG 7.
Thank you for your support, your donation, big or small, truly matters!
Suriname Energy Situation
Capital:
Paramaribo
Region:
Coordinates:
5.8333° N, 55.1667° W
Total Area (km²): It includes a country's total area, including areas under inland bodies of water and some coastal waterways.
XML error: Mismatched tag at line 6.
Population: It is based on the de facto definition of population, which counts all residents regardless of legal status or citizenship--except for refugees not permanently settled in the country of asylum, who are generally considered part of the population of their country of origin.
XML error: Mismatched tag at line 6. ()
Rural Population (% of total population): It refers to people living in rural areas as defined by national statistical offices. It is calculated as the difference between total population and urban population.
XML error: Mismatched tag at line 6. ()
GDP (current US$): It is the sum of gross value added by all resident producers in the economy plus any product taxes and minus any subsidies not included in the value of the products. It is calculated without making deductions for depreciation of fabricated assets or for depletion and degradation of natural resources.
XML error: Mismatched tag at line 6.2 ()
GDP Per Capita (current US$): It is gross domestic product divided by midyear population
XML error: Mismatched tag at line 6. ()
Access to Electricity (% of population): It is the percentage of population with access to electricity.
XML error: Mismatched tag at line 6.no data
Energy Imports Net (% of energy use): It is estimated as energy use less production, both measured in oil equivalents. A negative value indicates that the country is a net exporter. Energy use refers to use of primary energy before transformation to other end-use fuels, which is equal to indigenous production plus imports and stock changes, minus exports and fuels supplied to ships and aircraft engaged in international transport.
XML error: Mismatched tag at line 6.no data
Fossil Fuel Energy Consumption (% of total): It comprises coal, oil, petroleum, and natural gas products.
XML error: Mismatched tag at line 6.no data
Introduction
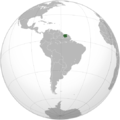
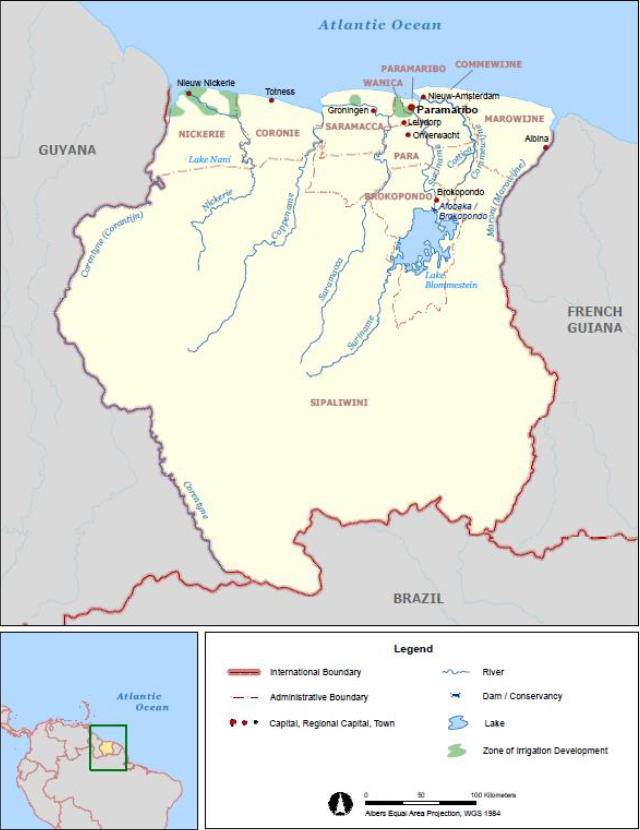
Suriname, also known as Republic of Suriname, is a country located on the north-eastern Atlantic coast of South America[1]. The country’s total area is below 165,000 Km2, which makes it the smallest country in South America[1]. 80% of the country’s area is covered with tropical rain forests, with only 1.5 million ha are considered suitable for agriculture[2]. The majority of the country’s inhabitants are located in the country’s north coast, particularly within and around the capital ‘Paramaribo’[1].
Suriname is bordered by French Guiana to the east, Guyana to the west, Brazil to the south & the Atlantic Ocean to the north[1][2]. The region in the north is mostly lowland coastal area, where most of the land has been cultivated, while the southern part consists of tropical rainforest and randomly distributed inhabited savanna along the county’s borders with Brazil[1].
The country’s climate is mostly hot and humid through the year; equatorial in coastal areas, tropical monsoon further inland and tropical savannah in the south-western portions of the country[1]. Suriname has two wet seasons; the 1st and the main one is from April to July, and the 2nd and shorter one is in the period December-January[1]. The northern populated area has four different seasons: a minor rainy season from early December to early February, a minor dry season from early February to late April, a major rainy season from late April to mid-August and a major dry season from mid-August to early December [2].
Suriname has a variety of natural resources, but the national economy is dominated by certain mining activities and agricultural products [1][3][4]. The primary mining products are: oil, bauxite and gold, while in the agriculture sector, rice and bananas are the dominant products[1][3][4]. Suriname is highly energy-independent due to the combination of the mining of fossil fuels and the significant wealth of hydropower, thus, energy-wise, it is a very self-sufficient country[3].
After Trinidad & Tobago, and Cuba, Suriname comes in as the 3rd largest oil producer in the Caribbean[3].
Suriname is a Small Island Developing State (SIDS).
Energy Situation
Overview
According to REEEP (2013), Suriname has small amounts of fossil fuels reserves, which are mostly exploited by the government-owned company ‘Staatsoli’. The country has a refinery, which has a production capacity of about 7,500 barrels/day[5]. With regard to these numbers, it is comprehendible that, amongst the Caribbean countries, Suriname is the least reliant on fossil fuels for electricity generation[5].
The most significant energy source in the country is considered to be hydro-electricity, which was used in 2010 to supply 95% of its electricity generation[5]. Notably, around 26% of Suriname’s total energy supply is generated through Lake Brokopondo’s hydropower system[5].
A study that was carried out in 2014 has analyzed the Suriname’s energy matrix as indicated in the following figures.
According to this analysis[3]:
- Suriname produces 17,350 barrels of oil equivalent if primary energy per day.
- The larger amount of this production comes from crude oil (15,600 boe/day).
- Hydropower accounts for 1,270 boe/day, while combustible renewables and waste account for 430 boe/day.
- The country imports approximately 300 boe/day of LPG, and 8,930 boe/day of oil products.
- The crude oil production mentioned above is refined and turned into 16,230 boe/day of oil products; thus divided to: 6,790 boe/day which are used for electricity generation and 9,380 boe/day are designed for export.
- Suriname also produces around 1,270 boe/day of hydropower & 2,200 boe/day of electricity.
- Suriname's total losses from heat and waste are approximately 6,000 boe/day.
- The country's total final consumption is about 11,000 boe/day, distributed as follows:
- 410 boe/day from CR&W.
- 300 boe/day from LPG.
- 2,200 boe/day from electricity.
- 8,080 boe/day from oil products.
- The country's total consumption is divided among different sectors as follows:
- 5,100 boe/day for transportation (~45%).
- 1,500 boea/day for residential sector.
- 1,200 boe/day for the industrial sector.
- Other sectors (e.g. agriculture ..) altogether combine for 3,200 boe/day.
Energy Access
| Total Access |
Rural | Urban | ||||
|---|---|---|---|---|---|---|
| Year | 2000 | 2010 | 2014 | 2016 | 2016 | 2016 |
| Population (%) | 97 | 91 | 88 | 87 | 96 | 69 |
| Year | 2000 | 2010 | 2014 | 2016 |
|---|---|---|---|---|
| Population (%) | 80 | 87 | 89 | 90 |
Production
Suriname’s total energy production in 2016 was approximately 0.9Mtoe[7].
Installed Capacity
In 2010, Suriname’s total installed electricity capacity was 355MW, which were distributed as follows: 15MW from Staatsoile, 78MW from Suralco, 82 MW from EBS and 180MW from hydropower[5].
The installed capacity by 2016 was around 504,000kW, from which 61% were from fossil fuels, 38% were from hydroelectric plants and about 1% from renewable sources[8][9].
Consumption
Import and Export
In 2017, Suriname’s total exports were approximately $2.69B, from which refined petroleum was about $133M (~5%), and rough wood was $68.2M (~2.5%)[10].
Electricity
| Indicator | Production | Consumption | Exports | Imports | Installed Generating Power |
|---|---|---|---|---|---|
| Capacity | 1.967 billion kWh | 1.75 kWh | 0 | 0 | 504,000 kW |
| World Ranking | 138 | 144 | 204 | 206 | 149 |
| Source | Fossil Fuels | Nuclear Fuels | Hydroelectric Plants | Renewable Sources |
|---|---|---|---|---|
| % of Total Installed Capacity | 61 | 0 | 38 | 1 |
| World Rank | 129 | 189 | 56 | 145 |
Around 5% of Suriname's total electricity production comes through small power generators, which are managed by the Ministry of Natural Resources[5]. These small power generators are located in remote interior areas of the country, and are operated by independent contractors[5].
Suriname's power sector consists of a number of individual power systems, of which some are interconnected[5]. In the region of Paramaribo, electric power is supplied by means of: 180MW of hydroelectric power, supplying about 75% of the energy, and 66MW of diesel generation[5].
Suriname's independent power systems are listed belowe:[11]
- EPAR (82MW, which is owned by EBS, and centers on Paramaribo and its surroundings).
- ENIC (15.9MW, which is also owned by EBS, and covers Nieuw Nickerei and its surrounding area).
- The Rural District Power Systems (around 18MW, and owned by EBS as well)
- Brokopondo's Distribution Systems.
All the mentioned power systems above are located along the coastline[11]. Within the country's interior, 111 villages are equipped diesel-fueled electricity generators, with a capacity range 15-149kW[11].
The main electricity suppliers in Suriname are[11]:
- Suralco L.L.C. (a private-owned company with 189MW).
- N.V. Energybedrijven Suriname (N.V. EBS).
- Staatsolie Power Company Suriname (15MW).
- Dienst Electriciteitsvoorziening (DEV).
From those suppliers, Suralco's Afobaka hydro plant is the largest, and it delivers the majority of the electricity consumed[11].
The electricity sector in Suriname has been foreced to be dependent on development aid, both directly and indirectly[11]. The required necessary investments in the sector are either postponed, dismissed or scaled down, consequently causing a backlog of maintenance activities, and an increasing inability to keep up with the growing demand for electricity[11].
Energy Security
Suriname is a rich country in its natural resources (uranium, oil, gas, sunlight, hydro, biomass etc.), which with the current available technologies can produce huge amounts of energy[11]. Yet, the country suffers few failures when it comes to the operational and maintenance practices of the existing power systems[11]:
- Improper and/or outdated practices.
- Reactive/corrective maintenance philosophy.
- Insufficient funds to execute preventive or predictive maintenance.
- Management acceptance of deviations from engineering and maintenance standards.
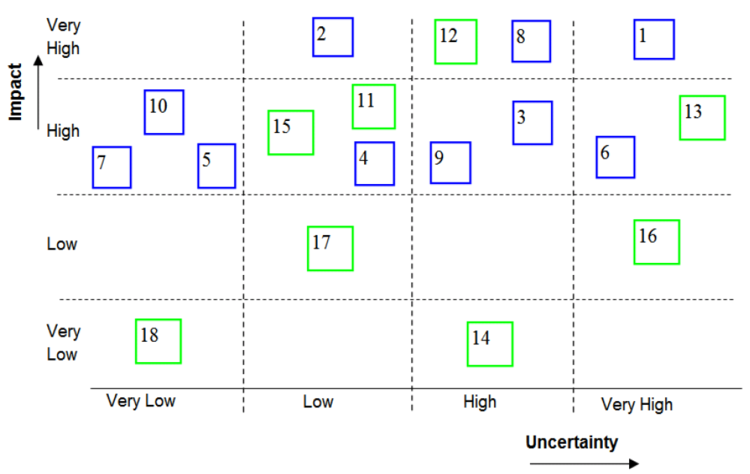
Between the richness of the natural resources of the country, and the poorness of efficient and proper operating and maintenance, the security of Suriname’s energy sector’s suffers many uncertainties, which can be divided into[11]:
-> (The numbers between the brackets are for a better understanding of the next figure)
- Internal Critical Uncertainties (stemming from within Suriname's own energy sector), such as:
- The quality of the government regarding (energy) policy making and deployment. (1)
- Energy consumption patterns. (2)
- Willingness of public to accept unpopular measures to increase energy security. (3)
- Adoption of energy efficiency and saving guidelines. (4)
- Perception of alternative energy by the population. (5)
- Discovery of significant natural resources reserves, in particular hydrocarbons, which are suitable for exploitation. (6)
- Depletion of natural resources. (7)
- Entrance/exit of large energy consumers. (8)
- Natural resource exploitation (e.g. deforestation, soil erosion) and its effects on energy production. (9)
- Rural poverty/urban migration. (10)
- External Critical Uncertainties (factors from the outer landscape -as shown in the figure bove-, e.g. from the global energy system), such as:
- Oil price behavior. (11)
- Climate change, natural disasters and their effects on Suriname’s energy system and renewable energy potential. (12)
- Global economic climate. (13)
- International technological breakthroughs and their deployment. (14)
- The moment of global oil production peaking. (15)
- Global willingness to put climate change above short-term, domestic and/or economic interests. (16)
- Transfer of new energy technologies to Suriname. (17)
- Relationship with neighboring countries. (18)
Renewable Energy
| Year | 2008 | 2009 | 2010 | 2011 | 2012 | 2013 | 2014 | 2015 | 2016 | 2017 |
|---|---|---|---|---|---|---|---|---|---|---|
| Installed Capacity (MW) | 180 | 180 | 180 | 180 | 180 | 181 | 186 | 188 | 188 | 188 |
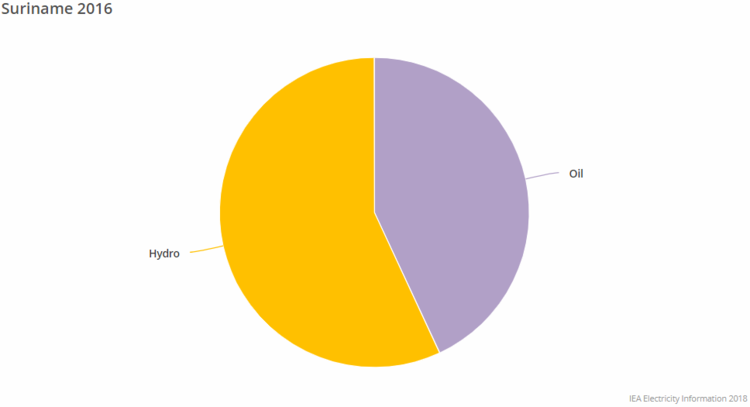
According to the graphs and reports from International Energy Agency (IEA) and International Renewable Energy Agency (IRENA), Suriname does not have a strong renewables' sector at the moment. The country's production of electricity comes mainly from hydro power.
Hydropower
According to the International Hydropower Association (IHA)'s 2017 report on global hydropower status, Suriname ranks as the 11th country in South-America in terms of installed capacity with 189MW in 2017[13].
As illustrated in the following graph, hydro-power generation utterly dominates the renewables' sector in the country, with about 100% Suriname's renewables' generating capacity.
| Year | 2008 | 2009 | 2010 | 2011 | 2012 | 2013 | 2014 | 2015 | 2016 | 2017 |
|---|---|---|---|---|---|---|---|---|---|---|
| Installed Capacity (MW) | 180 | 180 | 180 | 180 | 180 | 180 | 180 | 180 | 180 | 180 |
Furthermore, the Afobakka hydro dam, which is owned by Alcoa (Suralco), is considered to be the major renewable energy system in Suriname, generating a capacity of approximately 189MW[14].
Solar
The 2nd largest renewable energy system in the country is Rosebel Gold Mine Company’s grid-connected 5MWp PV system[14]. The system's generated electricity is used by the company for mining purposes[14].
The urban areas located in the interior of Suriname also have several ground-mounted and rooftop PV systems[14]. There exist as well the headquarters of the State Oil Company Suriname's 27kWp grid-connected PV systems, and the 500kw hybrid system (Diesel & PV) at a village in the interior of Suriname, named Atjoni[14].
In addition to the mentioned systems, the country has a limited number of small PV systems, which are installed in different places, including the Hinterland of Suriname, such as[14]:
- 3 kWp PV systems at a school in Botopasi village in the interior.
- 20 kWp PV system in Pelelutepu (Tepu) village in the southern part of Suriname.
- 4 kWp rooftop PV system at an elementary school in Gujaba village in the interior of Suriname.
Furthermore, stand-alone PV systems are used by the telecommunication companies for powering their towers in the country’s interior[14]. The ‘Medische Zending’, which is responsible for the health care, also uses PV systems’ generated electricity to power their cooling systems in their offices in the interior, and for keeping medicines and vaccines cool[14].
Alongside companies and schools, many citizens located in the urban areas of the Suriname’s interior have privately owned PV systems[14].
Finally, also solar boilers are used in the country for providing warm water in homes, yet on a small scale and mainly in the coastal region[14].
| Year | 2008 | 2009 | 2010 | 2011 | 2012 | 2013 | 2014 | 2015 | 2016 | 2017 |
|---|---|---|---|---|---|---|---|---|---|---|
| Installed Capacity (MW) | - | - | - | - | - | 1 | 6 | 6 | 6 | 6 |
Fossil Fuels
According to the Central Intelligence Agency (CIA) & the International Energy Agency (IEA)'s statistics, Suriname does not depend mainly on fossil fuels. The majority of the country's energy generation comes from hydro power.
The country has no clear statistics for natural gas or coal, but its fossil fuels' use comes solely from oil, as shown in the following chapter.
Crude Oil & Refined Petroleum Products
| Indicator | Production | Exports | Imports | Proved Reserves |
|---|---|---|---|---|
| Capacity | 17,000 bbl/day | 0 bbl/day | 820 bbl/day | 84.2 million bbl |
| World Ranking | 68 | 200 | 80 | 70 |
| Indicator | Production | Consumption | Exports | Imports |
|---|---|---|---|---|
| Capacity | 7,571 bbl/day | 13,000 bbl/day | 14,000 bbl/day | 10,700 bbl/day |
| World Ranking | 101 | 157 | 74 | 145 |
Key Problems of the Energy Sector
The main problems and challenges that face Suriname's energy sector are listed as follows[15][16]:
- Regulatory policies are weak, as clear policies are lacking, which makes it difficult to formulate goals and plans.
- Net-metering is not implemented.
- Feed-in tariff schemes cannot be deployed.
- Renewable portfolio standards are missing.
- Energy efficiency is lacking.
- Appliance labelling requirements do not exist.
- Fiscal incentives are inadequate.
- No public loans or grants aimed at energy efficiency are available.
- Decision makers lack the proper understanding to establish long term sustainable development plans.
- The shortage of expertise and the limited research capacity in the country.
- The existence of institutional and financial constraints.
Policy Framework, Laws and Regulations
Suriname’s electric sector regulations are dependent on contractual agreements, which are based on the 1957 Brokopondo Agreement.
As a member of the Caribbean Community (CARICOM), the country has targets of 20%, 28% and 47% renewable electricity generation to be reached by 2017, 2022 and 2027 respectively[17].
Suriname has no legislative framework for electricity or renewable energy, yet it is being developed by the country[17][5]. The country’s 2012 electric power sector draft green paper establishes the main guidelines for composing an electricity act[17]. This act should include energy security, judicial, institutional provisions and the need for an energy authority[17]. It also should contain the principles of cost recovery, energy and economic efficiency, and environmental impacts in the setting of the national utility (EBS) tariffs[17].
The project Development of Renewable Energy, Energy Efficiency and Electrification of Suriname (SU-G1001) was initiated in 2013 to promote the use and development of renewable energy and energy efficiency in the country[17].The project included solar, hydropower and bioenergy[17].
The Electricity Act, 2016 aims to update Suriname's power market's regulations for improving both technical and financial situations of the sector[18]. It also allows privatisation and enhancing the country's energy's regulatory framework[18].
EBS and Staatsolie have their own regulatory role in the country's energy section, as both are responsible for setting electricity's tariffs, both oil and gas consumption in the country[5]. the later is also engaged in capacity building programs for its own staff and customers[5]. Also, both companies are involved in regulating their service's quality, which includes frequent inspections and the accreditation of equipment and procedures in according to national standards[5].
The governmental role in establishing the legal framewrok for Suriname's energy sector is represented in the responsibility of the Ministry of Natural Resources to produce and enact the country's energy policy[5].
Institutional Set up in the Energy Sector
| Institution | Abbreviation + Website | Role |
|---|---|---|
| Energie Bedrijven Suriname/Energy Company Suriname | EBS |
|
| Staatsolie Maatschappij Suriname N.V./State Oil Company of Suriname | Staatsolie |
|
| Suriname Aluminum Company | Suralco |
|
| The Electrification Supply Department of the Ministry of Natural Resources | DEV |
|
| Natuurlijke Hulpbronnen/The Ministry of Natural Resources | NH |
|
Other Key Actors / Activities of Donors, Implementing Agencies, Civil Society Organisations
Further Information
- Solar Energy Opportunities in Suriname
- The impact of climate change on the wind energy resources of Suriname using regional climate model simulations
- Meeting the Energy Challenge, Regulatory Reforms are Key
- Sustainable Energy for all in the Caribbean
- The role of photovoltaics (PV) in the present and future situation of Suriname
- Energy in the Caribbean, challenges and opportunities
- Building on our own abilities, Suriname’s State Oil Company as a Development Agent
- Water-Energy-Food Security and Mining in Suriname, A project overview
- Caribbean Energy Sector, Macro-related challenges
- Reenergizing Suriname with less energy
- Wood Energy in Suriname, Contribution of Forest Sector to the Energy Supply
References
- ↑ 1.0 1.1 1.2 1.3 1.4 1.5 1.6 1.7 1.8 World Meteorological Organization (WMO) & Caribbean Institute for Meteorology and Hydrology (CIMH). (2018). Country Profile: Suriname. Retrieved from: http://rcc.cimh.edu.bb/files/2018/06/Country-Profile-Suriname.pdf
- ↑ 2.0 2.1 2.2 Food and Agriculture Organization of the United Nations (FAO). (2015). Country Profile – Suriname. Retrieved from: http://www.fao.org/3/ca0427en/CA0427EN.pdf
- ↑ 3.0 3.1 3.2 3.3 3.4 Ramón, E. & Humpert, M. (2014). Energy Matrix Country Briefings: Antigua & Barbuda, Bahamas, Barbados, Dominica, Grenada, Guyana, Haiti, Jamaica, St. Kitts & Nevis, St. Lucia, St. Vincent and the Grenadines, Suriname, and Trinidad & Tobago. Retrieved from: https://publications.iadb.org/en/publication/11241/energy-matrix-country-briefings-antigua-barbuda-bahamas-barbados-dominica-grenada
- ↑ 4.0 4.1 Roy, D. Bizikova, L. Borden, C. Swanson, D. & Huppé, G.A. (2015). Water-Energy-Food Security and Mining in Suriname. Retrieved from: https://www.iisd.org/sites/default/files/publications/water-energy-food-security-mining-suriname-project-overview.pdf
- ↑ 5.00 5.01 5.02 5.03 5.04 5.05 5.06 5.07 5.08 5.09 5.10 5.11 5.12 5.13 The Renewable Energy and Energy Efficiency Partnership (REEEP). (2013). Suriname (2012). Retrieved from: https://www.reeep.org/suriname-2012
- ↑ 6.0 6.1 Tracking SDG7. (2018). The Energy Progress Report. Retrieved From: https://trackingsdg7.esmap.org/data/files/download-documents/executive_summary.pdf
- ↑ International Energy Agency (IEA). (2018). Key World Energy Statistics – A Wealth of Energy Stats at your Fingertips. Retrieved From: https://webstore.iea.org/download/direct/2291?fileName=Key_World_2018.pdf
- ↑ https://theodora.com/wfbcurrent/suriname/suriname_energy.html
- ↑ 9.0 9.1 9.2 9.3 9.4 https://www.cia.gov/library/publications/the-world-factbook/geos/ns.html
- ↑ https://atlas.media.mit.edu/en/profile/country/sur/
- ↑ 12.0 12.1 12.2 Whiteman, A. Sohn, J. Arkhipova, I. & Elsayed, S. (2018). Renewable Capacity Statistics 2018. Retrieved From: https://www.irena.org/-/media/Files/IRENA/Agency/Publication/2018/Mar/IRENA_RE_Capacity_Statistics_2018.pdf
- ↑ International Hydropower Association (IHA). (2017). The 2017 Hydropower Status Report: an Insight into Recent Hydropower Development and Sector Trends around the World. Retrieved From: https://www.hydroworld.com/content/dam/hydroworld/online-articles/2017/08/2017%20Hydropower%20Status%20Report-1.pdf
- ↑ 14.0 14.1 14.2 14.3 14.4 14.5 14.6 14.7 14.8 14.9 Raghoebarsing, A. & Reinders, A. (2019). The Role of Photovoltaics (PV) in the Present and Future Situation of Suriname. Retrieved from: https://www.mdpi.com/1996-1073/12/1/185
- ↑ Inter-American Development Bank (IDB). (2015). Meeting the Energy Challenge: Regulatory Reforms are Key!. Retrieved from: https://www.imf.org/external/np/seminars/eng/2015/caribbean/pdf/gjohnson.pdf
- ↑ National Institute for Environment and Development in Suriname (NIMOS). (2013). Republic of Suriname National Report in Preparation of the Third International Conference on Small Island Developing States (SIDS). Retrieved from: https://sustainabledevelopment.un.org/content/documents/11859475suriname.pdf
- ↑ 17.0 17.1 17.2 17.3 17.4 17.5 17.6 Cabré, M.M. Lopez-Peña, A. Kieffer, G. Khalid, A. & Ferroukhi, R. (2015). Renewable Energy Policy Brief: Suriname. Retrieved from: https://tinyurl.com/y2f7br9a
- ↑ 18.0 18.1 http://www.lse.ac.uk/GranthamInstitute/law/electricity-act-2016/
- ↑ https://ecotravelrally.wordpress.com/2014/08/06/surinames-energy-system-what-are-the-main-issues/


