Knowledge fuels change
For over a decade, Energypedia has shared free, reliable energy expertise with the world.
We’re now facing a serious funding gap.
Help keep this platform alive — your donation, big or small, truly matters!
Thank you for your support
Difference between revisions of "United States of America Energy Situation"
***** (***** | *****) |
***** (***** | *****) |
||
| Line 136: | Line 136: | ||
| <br/> | | <br/> | ||
|} | |} | ||
| + | |||
| + | |||
| + | |||
| + | |||
| + | |||
| + | |||
| + | |||
| + | '''[http://www.eia.gov/state/seds/sep_prod/pdf/PT1_us.pdf Energy Production Estimates in Physical Units, United States, 1960 - 2009]''' | ||
| + | |||
| + | |||
| + | |||
| + | '''[http://www.eia.gov/state/seds/hf.jsp?incfile=sep_use/total/use_tot_usa.html&mstate=United%20States <span style="font-family: Arial, Helvetica; font-size: 14px; font-weight: bold; text-align: left; ">Energy Consumption Estimates for Major Energy Sources in Physical Units, 1960-2009</span>]''' | ||
| + | |||
| + | |||
| + | |||
| + | |||
== Renewable energy sources<br/> == | == Renewable energy sources<br/> == | ||
| Line 162: | Line 178: | ||
Low head/low power water energy sites in the conterminous United States<ref>http://hydropower.inel.gov/resourceassessment/pdfs/03-11111.pdf (pg. 29)</ref> | Low head/low power water energy sites in the conterminous United States<ref>http://hydropower.inel.gov/resourceassessment/pdfs/03-11111.pdf (pg. 29)</ref> | ||
| + | |- | ||
| + | | | ||
| + | |||
| + | '''[http://energy.gov/maps/us-hydropower-potential-existing-non-powered-dams <span style="text-align: -webkit-auto; ">Interactive map of existing hydropower sites </span>]''' | ||
| + | |||
| + | | style="text-align: -webkit-auto;width: 275px; " | <br/> | ||
|} | |} | ||
| Line 201: | Line 223: | ||
total number of hydroelectric plants in the united states | total number of hydroelectric plants in the united states | ||
| + | |- | ||
| + | | Interac | ||
| + | | <br/> | ||
|} | |} | ||
<br/></div><div><br/></div><div><br/></div> | <br/></div><div><br/></div><div><br/></div> | ||
=== Solar power === | === Solar power === | ||
| + | |||
| + | |||
| + | |||
| + | [http://energy.gov/maps/solar-energy-potential '''Interactive map of U.S solar potential'''] | ||
=== Biomass === | === Biomass === | ||
Revision as of 08:24, 23 April 2012
Overview
The United States of America | |||
| |
| ||
|
Capital |
Washington D.C 38°53'N 77°01'W | ||
|
Official language(s) |
None at federal level [a] | ||
|
Government |
Federal presidential constitutional republic | ||
|
President |
Barack Obama | ||
|
Total area |
9,826,675 km2[1] | ||
|
Population |
313,206,000 (2012)[2] | ||
|
Rural population |
55,700,625 (2011)[3] | ||
|
GDP (nominal) |
$15.065 trillion (2011)[4] | ||
|
GDP Per capita |
$48,147 (2011)[5] | ||
|
Currency |
United States Dollar $ USD | ||
|
Time zone |
(UTC- 5 to -10) Summer (DST) (UTC - 4 to -10) | ||
|
Electricity generation |
4,253.3 TWh/year (2009)[6] | ||
| Access to Electricity | ~100% | ||
|
Wind energy (installed capacity) |
43,635 MW (2011) [7] | ||
|
Solar Energy (installed capacity) |
3,954 MW (2011)[8] | ||
Energy situation
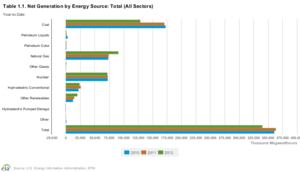
Energy in the United States of America are produced from a variety of sources. The primary source of energy in the United States is coal at 42% in 2011.[9]
| |
|
Energy Production Estimates in Physical Units, United States, 1960 - 2009
Energy Consumption Estimates for Major Energy Sources in Physical Units, 1960-2009
Renewable energy sources
http://205.254.135.7/renewable/ - Government source for in-depth information about renewable energy in the united States of America.
Hydropower
|
|
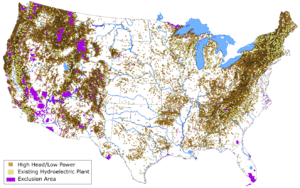
Existing hydroelectric plants and high head/low power water energy sites in the conterminous United States.[10]
|
|
Low head/low power water energy sites in the conterminous United States[11] | |
| Low-head-low power water energy sites in Alaska | |
| Existing hydroelectric plants and high head-low power water energy sites in Alaska |
| Distribution of the low head...... | |
| power category......... | |
| power class.......... | |
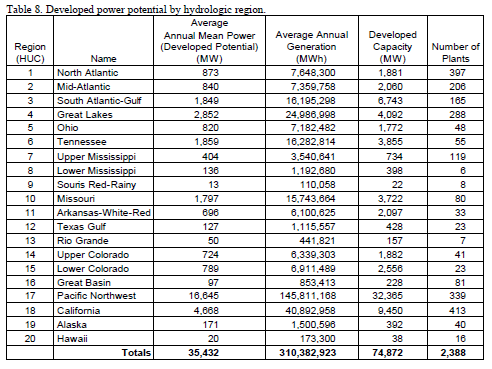
| Summary of results of water energy recourse assesment of the United States | |
|
Total capacity of hydroelectric plants in the united states by >sizes< | |
|
total number of hydroelectric plants in the united states | |
| Interac |
Solar power
Interactive map of U.S solar potential
Biomass
Wind power
Geothermal Power
Policy framework, laws and regulations
Institutional set up in the energy sector
Activities of other donors
References:
- ↑ "United States". The World Factbook. CIA. 2009-09-30. Retrieved 2010-01-05 (area given in square kilometers).
- ↑ U.S. POPClock Projection". U.S. Census Bureau. Figure updated automatically.
- ↑ http://www.tradingeconomics.com/united-states/rural-population-percent-of-total-population-wb-data.html
- ↑ United States". International Monetary Fund. Retrieved 2011-10-09.
- ↑ United States". International Monetary Fund. Retrieved 2011-10-09.
- ↑ http://www.energy.eu/stats/energy-electricity-production.html
- ↑ http://www.windpoweringamerica.gov/wind_installed_capacity.asp
- ↑ http://www.seia.org/galleries/pdf/SMI-YIR-2011-ES.pdf
- ↑ http://www.eia.gov/electricity/monthly/epm_table_grapher.cfm?t=epmt_1_1
- ↑ http://hydropower.inel.gov/resourceassessment/pdfs/03-11111.pdf (pg. 47)
- ↑ http://hydropower.inel.gov/resourceassessment/pdfs/03-11111.pdf (pg. 29)
- ↑ http://hydropower.inel.gov/resourceassessment/pdfs/03-11111.pdf (4.4 pg. 33)


