Knowledge fuels change
For over a decade, Energypedia has shared free, reliable energy expertise with the world.
We’re now facing a serious funding gap.
Help keep this platform alive — your donation, big or small, truly matters!
Thank you for your support
Difference between revisions of "United States of America Energy Situation"
***** (***** | *****) |
***** (***** | *****) m |
||
| (46 intermediate revisions by 5 users not shown) | |||
| Line 1: | Line 1: | ||
| − | + | {{CES Country | |
| + | |CES Country Name=United States of America | ||
| + | |CES Country Capital=Washington D.C | ||
| + | |CES Country Region North America=North America | ||
| + | |CES Country Coordinates=38.8833° N, 77.0167° W | ||
| + | }} | ||
| − | |||
| − | |||
| − | |||
| − | |||
| − | |||
| − | |||
| − | |||
| − | |||
| − | |||
| − | |||
| − | |||
| − | + | = Introduction = | |
| − | |||
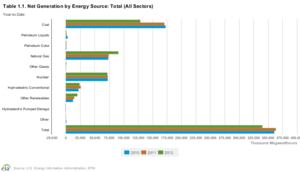
| − | + | Energy in the United States of America are produced from a variety of sources. The primary source of energy in the United States is coal at 42% in 2011.<ref>http://www.eia.gov/electricity/monthly/epm_table_grapher.cfm?t=epmt_1_1</ref> | |
| + | {| cellspacing="1" cellpadding="1" border="1" style="width:100%;" | ||
|- | |- | ||
| − | | | + | | style="width: 682px" | [[File:Energy supply for u.s.png|thumb|left|300pxpx|U.S energy consumption by source]]<br/> |
| − | + | | style="width: 682px" | [[File:United states renewable energy consumption.jpg|thumb|left|300pxpx|United states renewable energy consumption.jpg]] | |
| + | |} | ||
| + | |||
| + | <br/> | ||
| − | + | *[http://www.eia.gov/state/seds/sep_prod/pdf/PT1_us.pdf Energy Production Estimates in Physical Units, United States, 1960 - 2009]<br/> | |
| − | + | *[http://www.eia.gov/state/seds/hf.jsp?incfile=sep_use/total/use_tot_usa.html&mstate=United States Energy Consumption Estimates for Major Energy Sources in Physical Units, 1960-2009]<br/> | |
| − | | | + | [[United States of America Energy Situation#toc|►Go To Top]] |
| − | |||
| − | |||
| − | + | == Renewable Energy Sources<br/> == | |
| − | |||
| − | + | *[http://205.254.135.7/renewable/ Government source for in-depth information about renewable energy in the united States of America.]<br/> | |
| − | |||
| − | |||
| − | + | <br/> | |
| − | |||
| + | {| cellspacing="0" cellpadding="0" border="0" style="width: 500px" | ||
|- | |- | ||
| − | | | + | | [[File:Renewable Primary Energy consumption by source and sector.jpg|thumb|400px|alt=Renewable Primary Energy consumption by source and sector.jpg]] |
| − | + | |} | |
| − | + | [[United States of America Energy Situation#toc|►Go To Top]] | |
| − | |||
| − | + | === Hydropower === | |
| − | |||
| − | |||
| − | |||
| − | |||
| − | |||
| + | {| cellspacing="2" cellpadding="2" border="0" style="width: 100%" | ||
|- | |- | ||
| | | | ||
| − | + | [[File:Energy hydromap lrg.gif|thumb|left|300px|Energy hydromap lrg.gif|alt=Energy hydromap lrg.gif]] | |
| | | | ||
| − | + | [[File:Low head-low power water energy sites in the conterminous United States.png|thumb|left|300px|Low head-low power water energy sites in the conterminous United States.png|alt=Low head-low power water energy sites in the conterminous United States.png]]<br/> | |
|- | |- | ||
| | | | ||
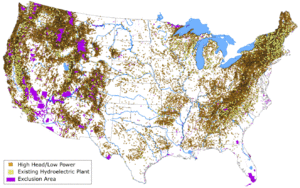
| − | + | Existing hydroelectric plants and high head/low power water energy sites in the conterminous United States.<ref>http://hydropower.inel.gov/resourceassessment/pdfs/03-11111.pdf (pg. 47)</ref> | |
| | | | ||
| − | < | + | Low head/low power water energy sites in the conterminous United States<ref>http://hydropower.inel.gov/resourceassessment/pdfs/03-11111.pdf (pg. 29)</ref><br/> |
|- | |- | ||
| − | | | + | | colspan="2" | |
| − | ''' | + | '''[http://energy.gov/maps/us-hydropower-potential-existing-non-powered-dams Interactive map of existing hydropower sites]''' |
| − | | | + | |} |
| − | |||
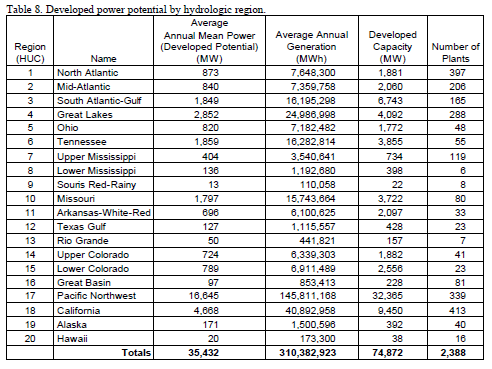
| − | + | "The Alaska Region contains the largest total potential with its slightly less than 90,000 MW of potential, which is approximately 30% of the total power potential of the United States. The Pacific Northwest Region has the second highest amount of total potential with slightly more than 76,000 MW of potential. Together these two regions contain over half (55%) of the U.S. power potential. From the perspective of the largest percentage of total power potential that has been developed, the Great Lakes Region (66%) and the Tennessee Region (37%) are particularly noteworthy with the next highest regions being the Lower Colorado (23%), Pacific Northwest (22%), South Atlantic-Gulf (21%), and California (17%)."<ref name="U.S DOE: Water Energy Resources of the United States with Emphasis on Low Head/Low Power Resources">http://hydropower.inel.gov/resourceassessment/pdfs/03-11111.pdf (4.4 pg. 33)</ref> | |
| − | |||
| − | |||
| − | + | <br/> | |
| − | |||
| + | {| cellspacing="0" cellpadding="0" border="0" style="width: 100%" | ||
|- | |- | ||
| − | | | + | | [[File:Low-head-low power water energy sites in Alaska.png|thumb|left|300px|Low-head-low power water energy sites in Alaska|alt=Low-head-low power water energy sites in Alaska.png]] |
| − | + | | [[File:Existing hydroelectric plants and high head-low power water energy sites in Alaska.png|thumb|left|300px|Existing hydroelectric plants and high head-low power water energy sites in Alaska|alt=Existing hydroelectric plants and high head-low power water energy sites in Alaska.png]] | |
| − | + | |} | |
| − | | | ||
| − | |||
| − | + | <br/> | |
| + | {| cellspacing="0" cellpadding="0" border="0" style="width: 100%" | ||
|- | |- | ||
| − | | | + | | colspan="2" | [[File:Developed power potential by hydrologic region.png|thumb|left|492px|Developed power potential by hydrologic region|alt=Developed power potential by hydrologic region.png]]<br/> |
| − | |||
| − | |||
| − | | | ||
|- | |- | ||
| − | | | + | | colspan="2" | [[File:Summary of results of water energy resource assessment of the United States.png|thumb|left|570px|Summary of results of water energy recourse assessment of the United States]]<br/> |
| − | | | ||
|- | |- | ||
| − | | | + | | style="width: 50%;" | [[File:Total capacity of hydroelectric plants in the united states by sizes.png|thumb|left|300px|Total capacity of hydroelectric plants in the united states by size.|alt=Total capacity of hydroelectric plants in the united states by sizes.png]] |
| − | + | | style="width: 50%;" | [[File:Total number of hydroelectric plants in the united states.png|thumb|left|300px|Total number of hydroelectric plants in the united states]] | |
| + | |} | ||
| + | |||
| + | [[United States of America Energy Situation#toc|►Go To Top]] | ||
| − | + | <br/> | |
| − | |||
| − | |||
| − | |||
| − | + | === Solar Power<br/> === | |
| − | |||
| + | *[http://energy.gov/maps/solar-energy-potential Interactive map of U.S solar potential] | ||
| + | <br/> | ||
| − | {| | + | {| cellspacing="0" cellpadding="0" border="0" style="width: 100%" |
|- | |- | ||
| − | | | + | | |
| + | [[File:Solar Growth.jpg|border|left|500px|alt=Solar Growth.jpg]] | ||
|} | |} | ||
| − | |||
| − | |||
| − | + | [[United States of America Energy Situation#toc|►Go To Top]] | |
| − | + | <br/> | |
| − | === | + | === Biomass === |
| − | {| | + | {| cellspacing="0" cellpadding="0" border="0" style="width: 100%" |
|- | |- | ||
| | | | ||
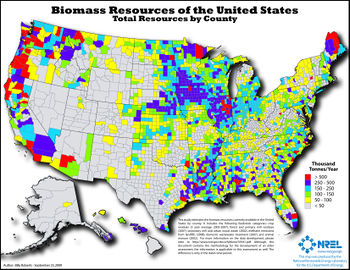
| − | [[File: | + | [[File:Map biomass total us.jpg|thumb|left|350px|Total Biomass Resources of the United States by county|alt=Map biomass total us.jpg]] |
| − | |||
| − | |||
| − | |||
| − | | | ||
| − | |||
| + | |} | ||
| + | [[United States of America Energy Situation#toc|►Go To Top]] | ||
| + | <br/> | ||
| + | === Wind Power === | ||
| + | {| cellspacing="0" cellpadding="0" border="0" style="width: 100%" | ||
| + | |- | ||
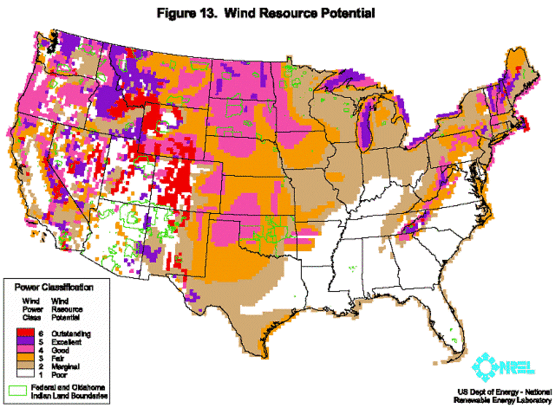
| + | | [[File:Windpotential.gif|thumb|left|555px|Wind Resource Potential in the United States.]]<br/> | ||
|- | |- | ||
| − | | [[File: | + | | |
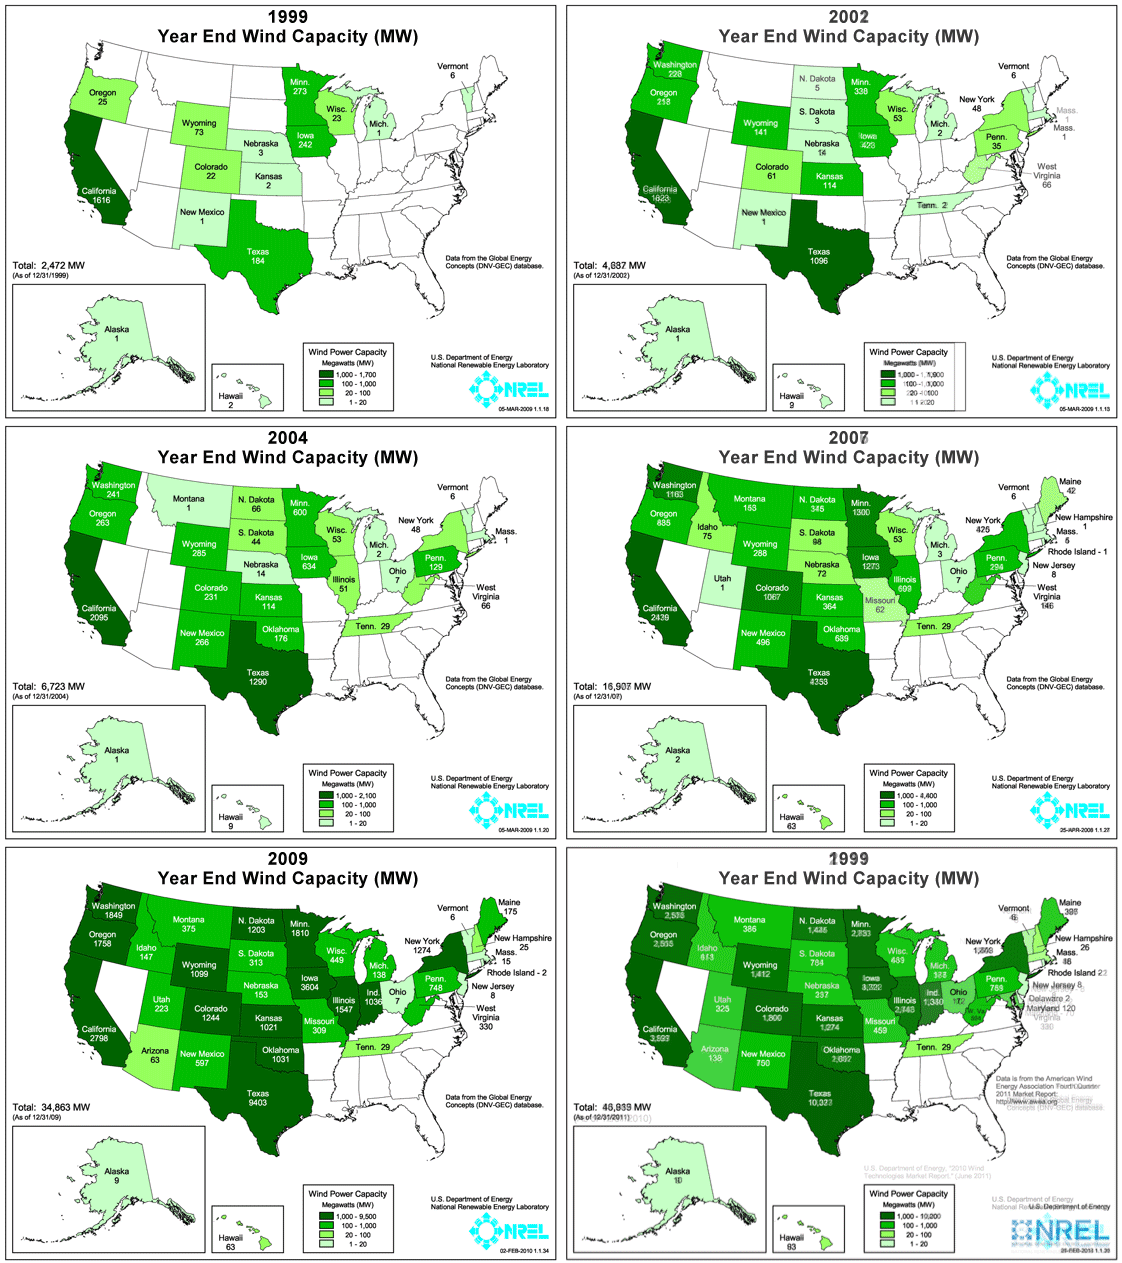
| − | + | [[File:Installed wind capacity anime.gif|thumb|left|561px|Progressive installed capacity animation|alt=Installed wind capacity anime.gif]] | |
| − | |||
|} | |} | ||
| + | <div><br/></div> | ||
| + | [[United States of America Energy Situation#toc|►Go To Top]] | ||
| − | + | = References<br/> = | |
| − | + | <references /><br/> | |
| − | + | [[United States of America Energy Situation#toc|►Go To Top]] | |
| − | |||
| − | |||
| − | |||
| − | |||
| − | |||
| − | |||
| − | |||
| − | |||
| − | |||
| − | |||
| − | |||
| − | |||
| − | |||
| − | |||
| − | |||
| − | |||
| − | [[Category: | + | [[Category:North_America]] |
[[Category:United_States_of_America]] | [[Category:United_States_of_America]] | ||
Latest revision as of 20:51, 10 July 2018
Capital:
Washington D.C
Region:
Coordinates:
38.8833° N, 77.0167° W
Total Area (km²): It includes a country's total area, including areas under inland bodies of water and some coastal waterways.
XML error: Mismatched tag at line 6.
Population: It is based on the de facto definition of population, which counts all residents regardless of legal status or citizenship--except for refugees not permanently settled in the country of asylum, who are generally considered part of the population of their country of origin.
XML error: Mismatched tag at line 6. ()
Rural Population (% of total population): It refers to people living in rural areas as defined by national statistical offices. It is calculated as the difference between total population and urban population.
XML error: Mismatched tag at line 6. ()
GDP (current US$): It is the sum of gross value added by all resident producers in the economy plus any product taxes and minus any subsidies not included in the value of the products. It is calculated without making deductions for depreciation of fabricated assets or for depletion and degradation of natural resources.
XML error: Mismatched tag at line 6.2 ()
GDP Per Capita (current US$): It is gross domestic product divided by midyear population
XML error: Mismatched tag at line 6. ()
Access to Electricity (% of population): It is the percentage of population with access to electricity.
XML error: Mismatched tag at line 6.no data
Energy Imports Net (% of energy use): It is estimated as energy use less production, both measured in oil equivalents. A negative value indicates that the country is a net exporter. Energy use refers to use of primary energy before transformation to other end-use fuels, which is equal to indigenous production plus imports and stock changes, minus exports and fuels supplied to ships and aircraft engaged in international transport.
XML error: Mismatched tag at line 6.no data
Fossil Fuel Energy Consumption (% of total): It comprises coal, oil, petroleum, and natural gas products.
XML error: Mismatched tag at line 6.no data
Introduction
Energy in the United States of America are produced from a variety of sources. The primary source of energy in the United States is coal at 42% in 2011.[1]
- Energy Production Estimates in Physical Units, United States, 1960 - 2009
- States Energy Consumption Estimates for Major Energy Sources in Physical Units, 1960-2009
Renewable Energy Sources
Hydropower
|
| |
|
Existing hydroelectric plants and high head/low power water energy sites in the conterminous United States.[2] |
Low head/low power water energy sites in the conterminous United States[3] |
"The Alaska Region contains the largest total potential with its slightly less than 90,000 MW of potential, which is approximately 30% of the total power potential of the United States. The Pacific Northwest Region has the second highest amount of total potential with slightly more than 76,000 MW of potential. Together these two regions contain over half (55%) of the U.S. power potential. From the perspective of the largest percentage of total power potential that has been developed, the Great Lakes Region (66%) and the Tennessee Region (37%) are particularly noteworthy with the next highest regions being the Lower Colorado (23%), Pacific Northwest (22%), South Atlantic-Gulf (21%), and California (17%)."[4]
Solar Power
Biomass
Wind Power
References
- ↑ http://www.eia.gov/electricity/monthly/epm_table_grapher.cfm?t=epmt_1_1
- ↑ http://hydropower.inel.gov/resourceassessment/pdfs/03-11111.pdf (pg. 47)
- ↑ http://hydropower.inel.gov/resourceassessment/pdfs/03-11111.pdf (pg. 29)
- ↑ http://hydropower.inel.gov/resourceassessment/pdfs/03-11111.pdf (4.4 pg. 33)


